One number for the market's real buy / sell pressure.
We're traders, same as you — working to find an edge. We found one they can't hide: the live balance of resting buy and sell orders, the pressure the brokerage houses don't log and can't spin. BitClock turns it into a single number you can read in a second — on your desktop, your lock screen, or your wrist. No indicators to configure, no chart to misread.
No broker logs this number. The order-book depth ratio isn't stored by any brokerage — so we stood up our own server and started logging it ourselves, every second, around the clock. That was back in October 2025. Today BitClock sits on nearly a year of continuous history in a dataset that, as far as we can tell,no one else has. It was built for one trading desk first — and now it's yours to read.
Everything is built around that one reading.
Three surfaces, one number: live on the clock, pushed to you at your threshold, and the full depth picture for subscribers.
Live Ratio & Clock
The core reading, recalculated continuously from real order-book depth — glanceable in under a second, day or night.
Alerts, Widget, Lock Screen
Set a threshold once. BitClock reaches you through your phone's widget, lock screen, or a push alert the moment it's crossed.
Daily Extremes & Depth
Subscribers see the ratio's daily extremes (R-HOD / R-LOD) and the live bid & ask depth behind the number — with a scrollable history archive coming soon.
The book behind the price, on your wrist
Reading the order book used to mean a desk and a wall of charts. On your wrist it is one measured number — resting ask depth ÷ resting bid depth near the live price — in a watch-face slot you read the way you read the time. A glance carries what a session used to.
Wear OS
A watch-face complication with the live ratio, a Tile one swipe away with the condensed clock stack, and a small companion app that relays sign-in and data from your phone.
Apple Watch
Watch-face complications in the accessory slots, plus the phone's Live Activity in the watch's Smart Stack on iOS 18 with watchOS 11. Ships inside the iPhone app.
What the watch shows
- The ratio itself in the smallest slots — always a number, never a gauge.
- Larger slots add the day's high and low readings and the BTC price.
- The condensed clock stack, one swipe from the watch face on Wear OS.
- Every reading carries its age: old data dims and shows its timestamp instead of posing as live.
Watch faces refresh on the watch's schedule — minutes, not seconds; the phone and the web dashboard are the live, once-a-second surfaces.
The watch uses the same account and subscription as the phone — the live ratio, BTC price and 24-hour stats show for everyone, and subscribers see the full stack (the day's extremes and the depth pair) on the wrist. Nothing extra to buy, no separate watch app; locked slots read "SUBS ONLY".
See pressure shift in real time.
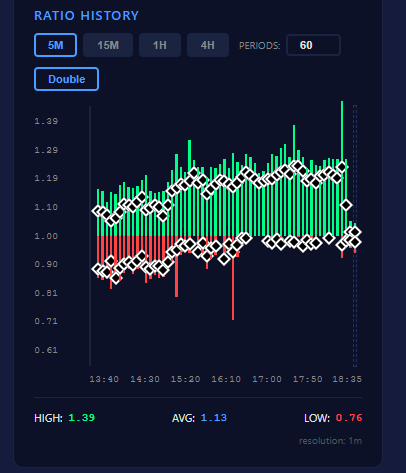
The dashboard's ratio history view, as it runs today — sixty five-minute periods, each bar spanning the range above and below the 1.00 baseline, with diamonds marking the average reading on each side.